Worth posting again….. 🙂
6th Grade Math – Mrs. VonFeldt
This week we will look at relationships between variables. We will begin by discussing independent and dependent variables. A dependent variable is the value that DEPENDS on the other quantity. For example, the amount earned (dependent) DEPENDS on the number of hours worked (independent). We use our relationships to create input/output tables, and write equations to represent situations. By the end of the week, students should be able to graph ordered pairs from their tables on coordinate planes.
7th Grade Math – Mrs. VonFeldt & Mrs. Evans
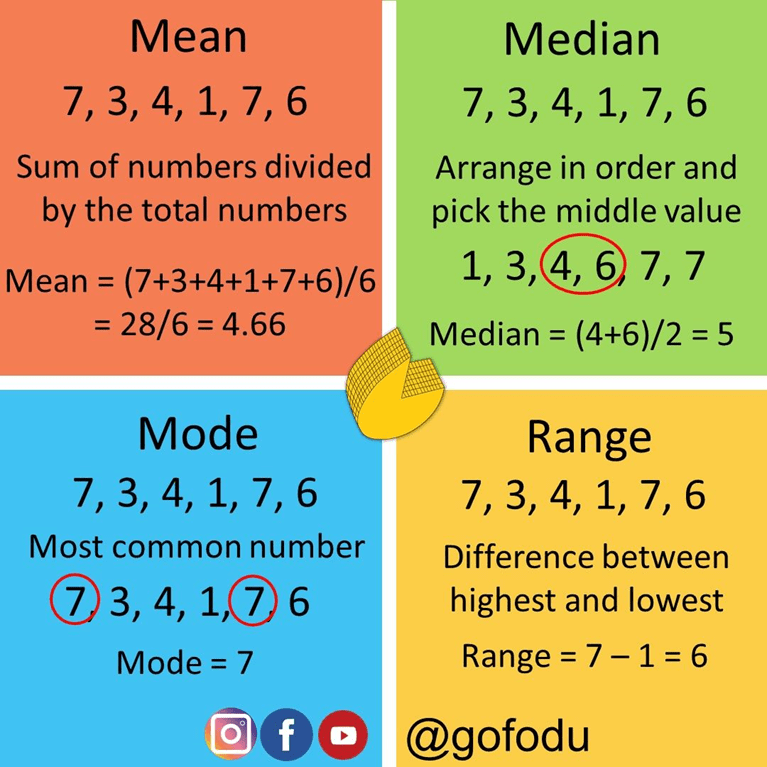
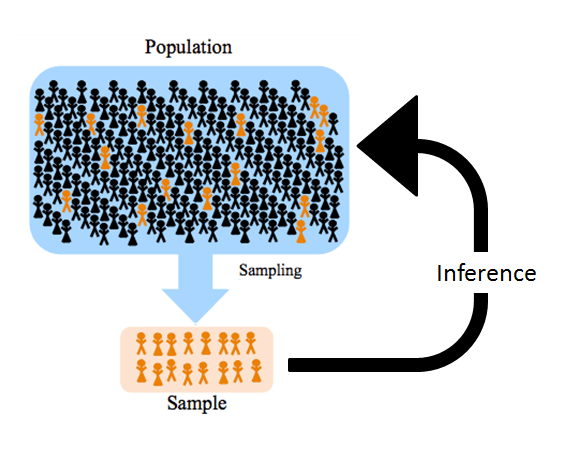
This week we will continue studying statistics as we learn to compare two data sets by comparing their dot and box plots. The objective is to use the data gathered in a study to make good decisions. We will do a project to finish up this unit. Our project will involve designing a product, determining it’s manufacturing costs and assessing sampling data to determine what price we should place on our product in order to make adequate profit.

8th Grade Math – Mrs. Evans
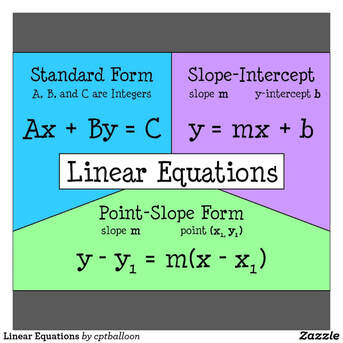
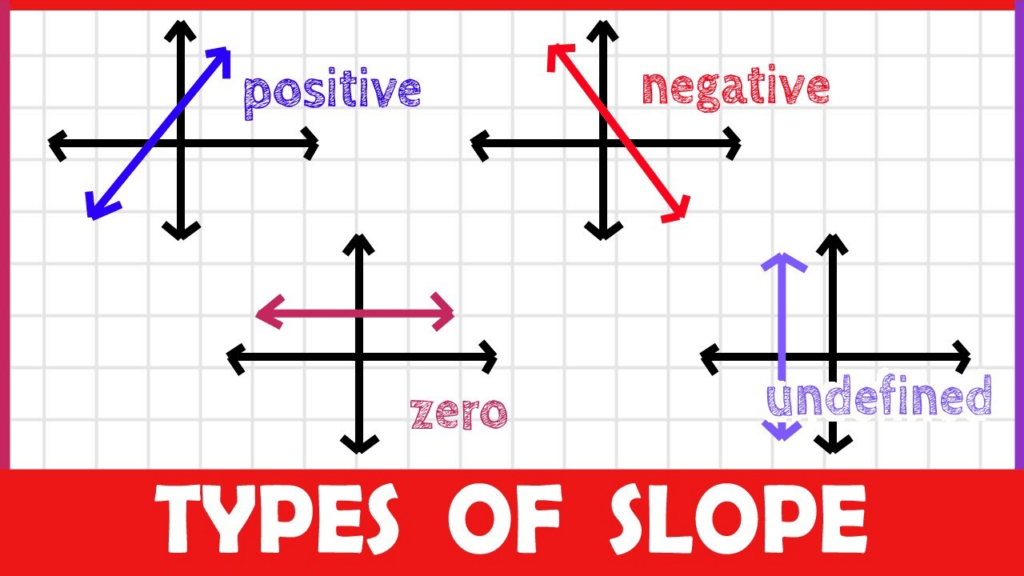
This week in 8th grade math we will add to our understanding of linear functions by studying the point slope form of lines. Here is a video about linear functions that can help students and families build understanding:
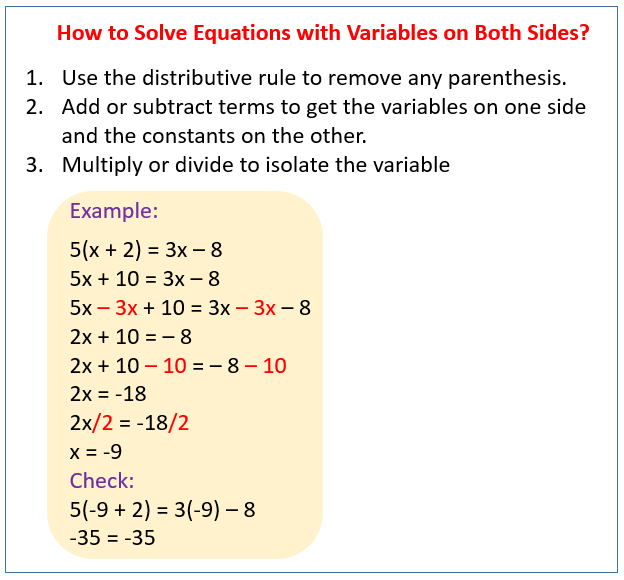
Algebra – Mrs. VonFeldt
This week in Algebra we are exploring parabolas, the graphs of quadratic functions. Each team has created a quadratic poster and has come up with things they notice and things they wonder about parabolas. We will discuss how to quickly find the vertex, x and y-intercepts, and line of symmetry of a quadratic function. Once we have these key pieces, graphing becomes quick and easy!